
Understanding Price Action and Market Trends
Learn how to read price movements and identify trends that drive market decisions. We'll cover support and resistance levels, trend direction, and what signals actually matter when you're watching the charts.

What's Price Action, Really?
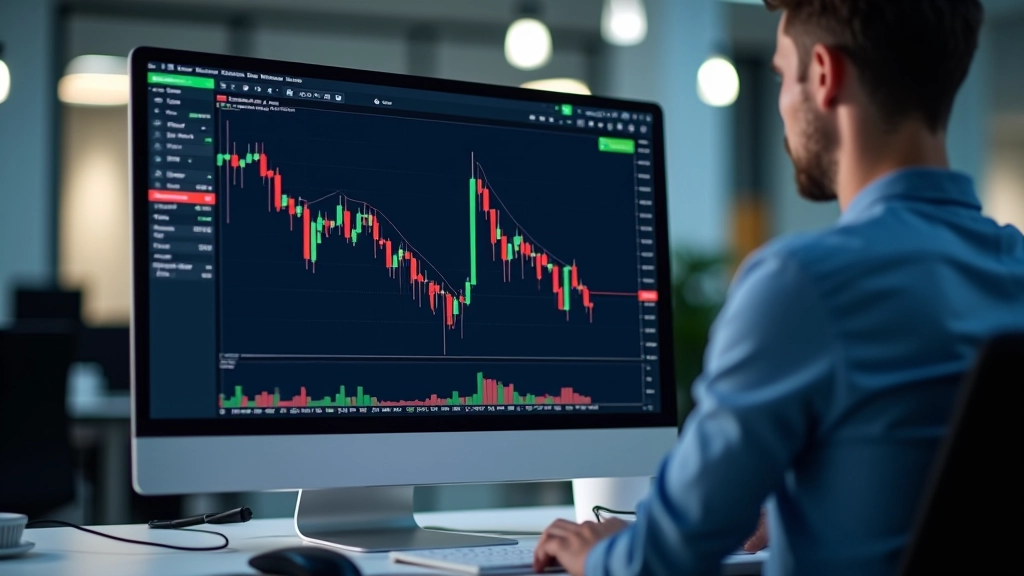
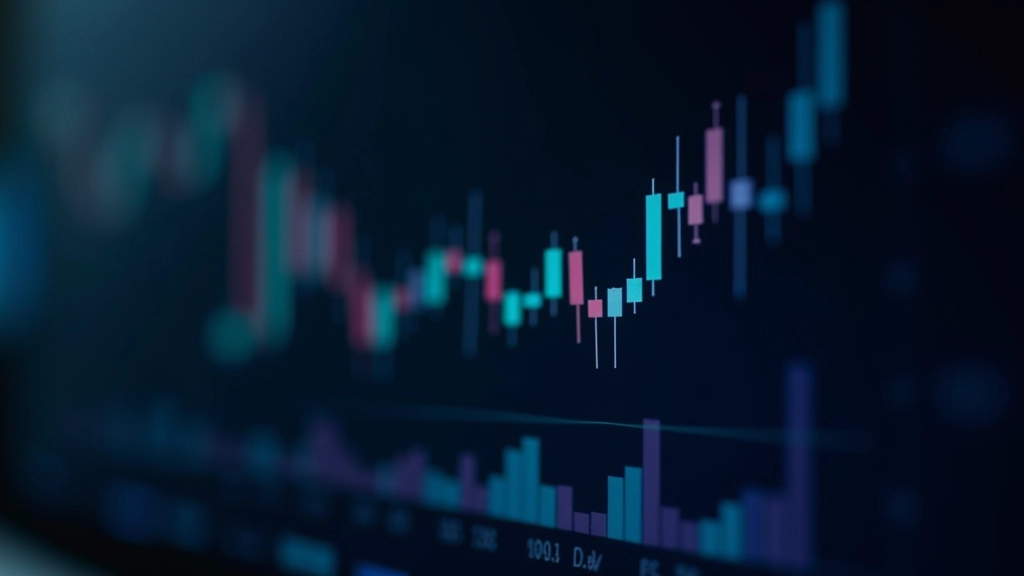
Price action is simply how the market moves. It's the actual price data—opens, closes, highs, and lows—displayed on your chart. No fancy indicators needed. When you look at raw price movement, you're seeing what traders are actually doing with their money, which is way more honest than any indicator can be.
The thing is, most traders overthink this. They'll load up their charts with 15 different indicators and miss what's right in front of them. Price action strips away the noise. It shows you where buyers and sellers are fighting. When price bounces off a level multiple times, that's not coincidence—it's institutional money respecting those zones.
We teach price action first because it's the foundation. Everything else builds on understanding how price actually moves. And once you've got it? You'll see patterns everywhere.
Support and Resistance: The Zones That Matter
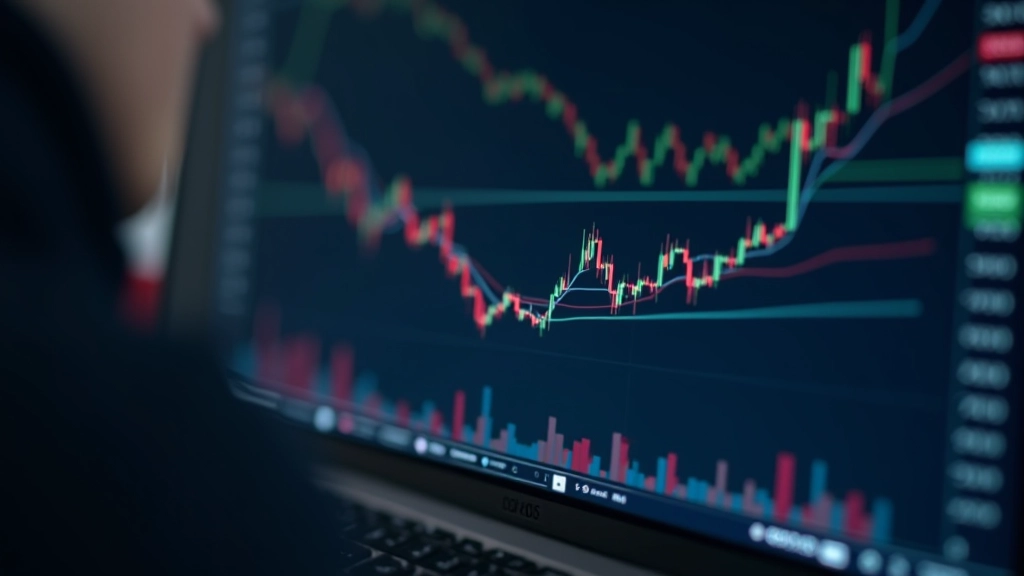
Support is where price has bounced up from before. Resistance is where it's bounced down from. These aren't magic lines—they're zones where traders have memories. If you sold at 45.50 three months ago and lost money, you're watching that price level again. When it comes back, you're probably watching it closely.
You'll notice that price doesn't bounce exactly at the same number twice. It's a zone, usually within a few points. That's why we don't get too precise about it. You're looking for clusters—areas where price has touched and bounced 2, 3, or 4 times. Those zones are strong.
Key point: The more times price tests a level without breaking through, the stronger that level becomes. When it finally breaks, expect a move. That's when things get interesting.
Educational Note: This article provides informational content about market analysis concepts for learning purposes. Understanding price action and trend analysis are educational topics in financial literacy. Markets involve risk, and past price movements don't guarantee future results. Individual circumstances vary, and you should conduct your own research or consult with qualified financial professionals before making any trading decisions.
Identifying Trends: Higher Highs and Lower Lows
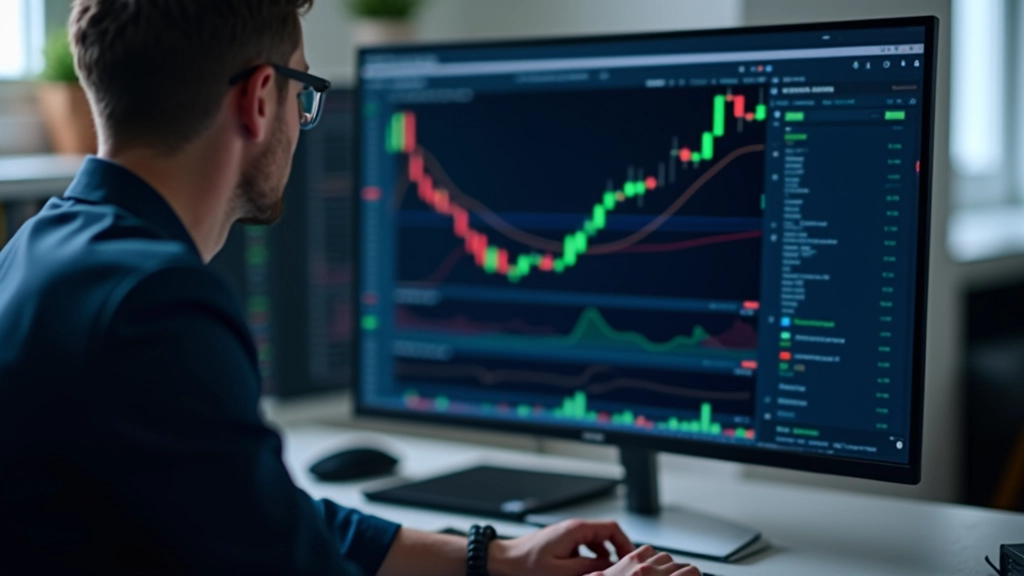
An uptrend is when price makes higher highs and higher lows. That's it. You don't need a moving average to tell you the trend is up. Just look at the pattern. If the last high is higher than the previous high, and the last low is higher than the previous low, you're in an uptrend.
Downtrends work the opposite way. Lower highs and lower lows. When price makes a lower low, it's saying the sellers are still in control. They're pushing price down. When you see that pattern repeating, you know the direction.
The tricky part comes when trends change. That's when you'll see what we call a "break of structure." Maybe price has been making higher lows, then suddenly it makes a lower low than expected. That's often a signal that the uptrend is weakening. Not a guarantee, but a warning sign worth paying attention to.
- Uptrend: Higher highs + higher lows = buyers winning
- Downtrend: Lower highs + lower lows = sellers winning
- Sideways: Oscillating between two levels = indecision
Candlestick Patterns: What the Candles Tell You
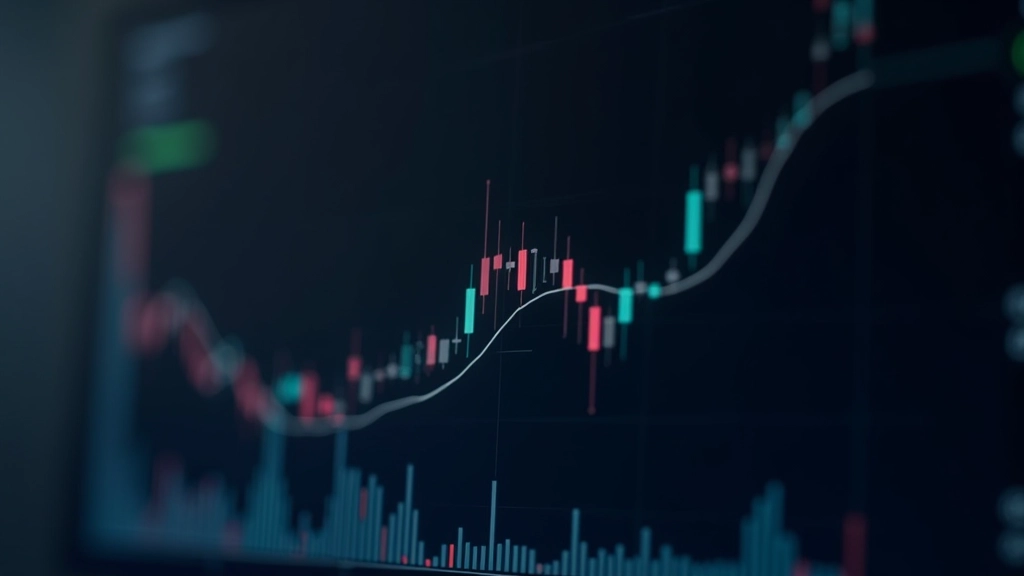
Candlesticks show the battle between buyers and sellers in a specific timeframe. The body of the candle shows where price opened and closed. The wicks show where price went during that period. If there's a long wick above the body, it means buyers pushed price up, then sellers brought it back down. That's rejection of higher prices.
A pin bar is a candle with a small body and a long wick in one direction. It's saying "we tried to go there, but there's nothing for us." That's useful information. When you see a pin bar at resistance, it's often a sign sellers are stepping in. We look for pin bars at key levels because they show us where the rejection happened.
Don't memorize 50 candlestick patterns. Focus on the ones that repeat at your key support and resistance levels. That's where the pattern actually matters because it's happening at a place where traders are watching.
Market Structure: The Big Picture Matters
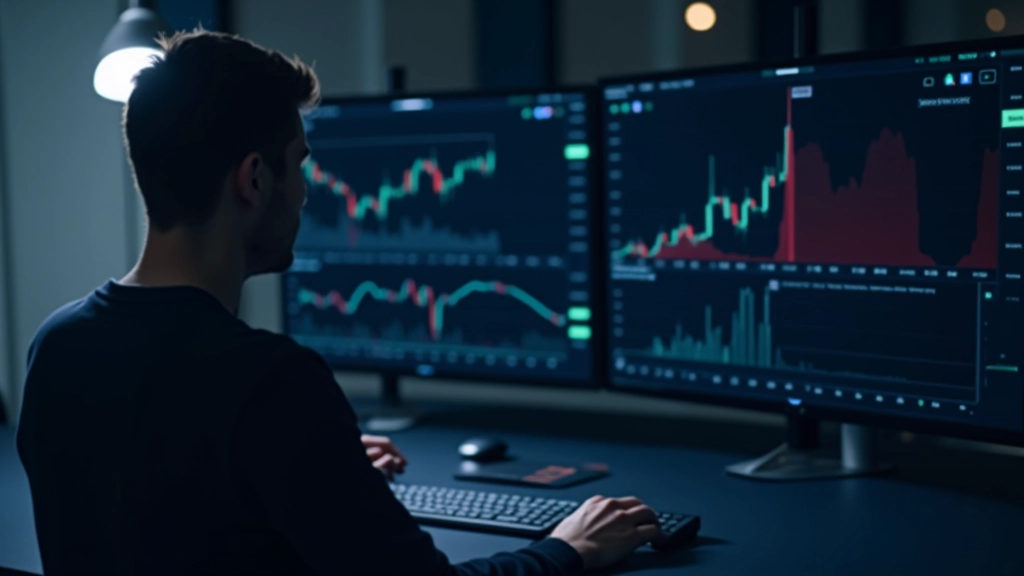
Market structure is how price has moved over a longer timeframe. Before you trade a 5-minute chart, you need to understand what's happening on the daily or weekly chart. Are we in an overall uptrend or downtrend? That context changes everything about how you interpret the smaller moves.
Here's something traders miss: You can have a bearish pattern on a 1-hour chart, but if the daily trend is strongly up, that 1-hour dip might just be a buying opportunity. The bigger structure tells you the probability. Trading against the daily trend is like swimming upstream—possible, but exhausting.
We teach our students to always check at least two timeframes. Look at the daily structure first. Then zoom into your trading timeframe. You'll notice your entry points line up better with support and resistance when they also align with the bigger trend.
Start with the Basics, Build from There
Price action trading isn't complicated. You're learning to read a language that markets speak every day. Support and resistance show you where traders care. Trends show you direction. Candlestick patterns show you rejection or acceptance of price levels. Structure gives you context.
The best part? You don't need to pay for fancy software or indicators. A basic charting platform and these concepts are enough to start. Most traders overcomplicate things, but the ones who make consistent decisions use these fundamentals over and over.
Your next step is practice. Open a chart right now. Identify the support and resistance levels. Mark the higher highs and higher lows. See if you can spot the trend. Don't trade anything yet—just observe. Once these patterns become natural to you, everything else in trading becomes easier. That's when you're ready for the next level.